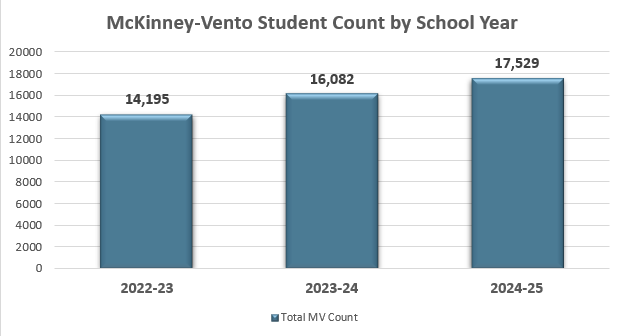
The chart shows a consistent increase in the total number of students identified under the McKinney-Vento Homeless Assistance Act over the three-year period. In 2022-23, 14,195; 2023-24, 16,082; and 2024-25, 17,529. From 2022-23 to 2024-25, there was an increase of 3,334 students, which is approximately 23.5% growth.
These pie charts include the last three years (2022-23, 2023-24, 2024-25) for Primary Nighttime Residence. “Doubled up" (staying with others due to economic hardship) is the largest category across all years, and it's growing — from 53.4% in 2022-23 to 60.6% in 2024-25.
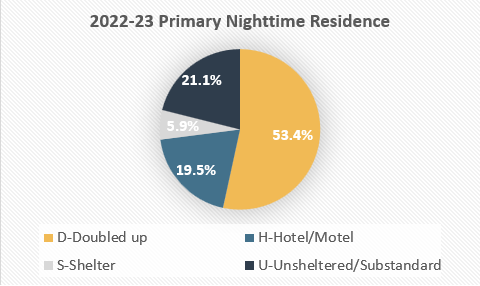
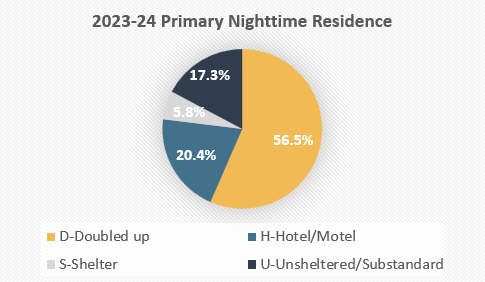
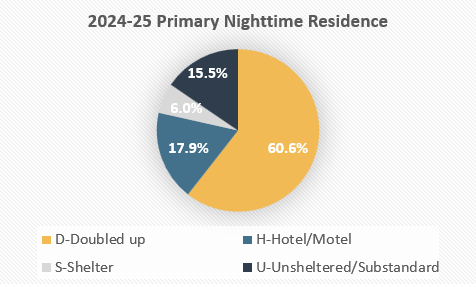
Yearly overview chart of Primary Nighttime Residence for McKinney-Vento
| McKinney-Vento Residence Type |
SY 2022-23 |
SY 2023-24 |
SY 2024-25 |
| Doubled up |
53.4% |
56.5% |
60.6% |
| Hotel/Motel |
19.5% |
20.4% |
17.9% |
| Shelter |
5.9% |
5.8% |
6.0% |
| Unsheltered/Substandard |
21.1% |
17.3% |
15.5% |
This table shares the different subgroups and how each of those groups were represented in the total number of students experiencing homelessness that year. Note: These subgroups are not mutually exclusive. It is possible for homeless students to be counted in more than one subgroup.
- Students that are experiencing homelessness and have a disability have remained stable over the past three school years and is the largest subgroup.
- Unaccompanied decreased from 6.1% to 4.8% but showed a slight recovery in 2024-25. Statistically, we would expect this to be 6-8% of the McKinney-Vento population based on national averages.
| McKinney-Vento Special Populations |
|
|
|
|
2022-23 |
2023-24 |
2024-25 |
| Migrant |
0.4% |
0.6% |
1.1% |
| Immigrant |
6.8% |
10.3% |
9.5% |
| Multilingual Learners |
12.6% |
15.2% |
13.1% |
| IDEA |
25.0% |
24.3% |
24.5% |
| Unaccompanied Youth |
6.1% |
4.6% |
4.8% |
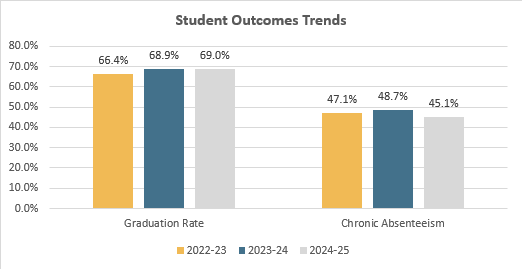
Consistent Improvement in the graduation rate. It improved every year from 66.35% (2022-23)→ 68.89% (2023-24) → 68.98% (2024-25)
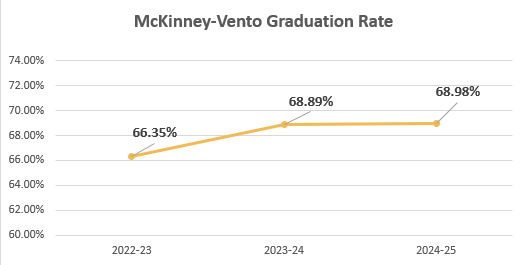
Student Outcomes Trends
There is a positive correlation with absenteeism and graduation. In 2024-25, as chronic absenteeism decreased (from 48.65% to 45.10%), graduation rate increased! Our School Districts are working hard to stabilize students to increase student success!